


Oops! Something went wrong while submitting the form.

Lierika Nemykina
Customer Operation Department Team Lead
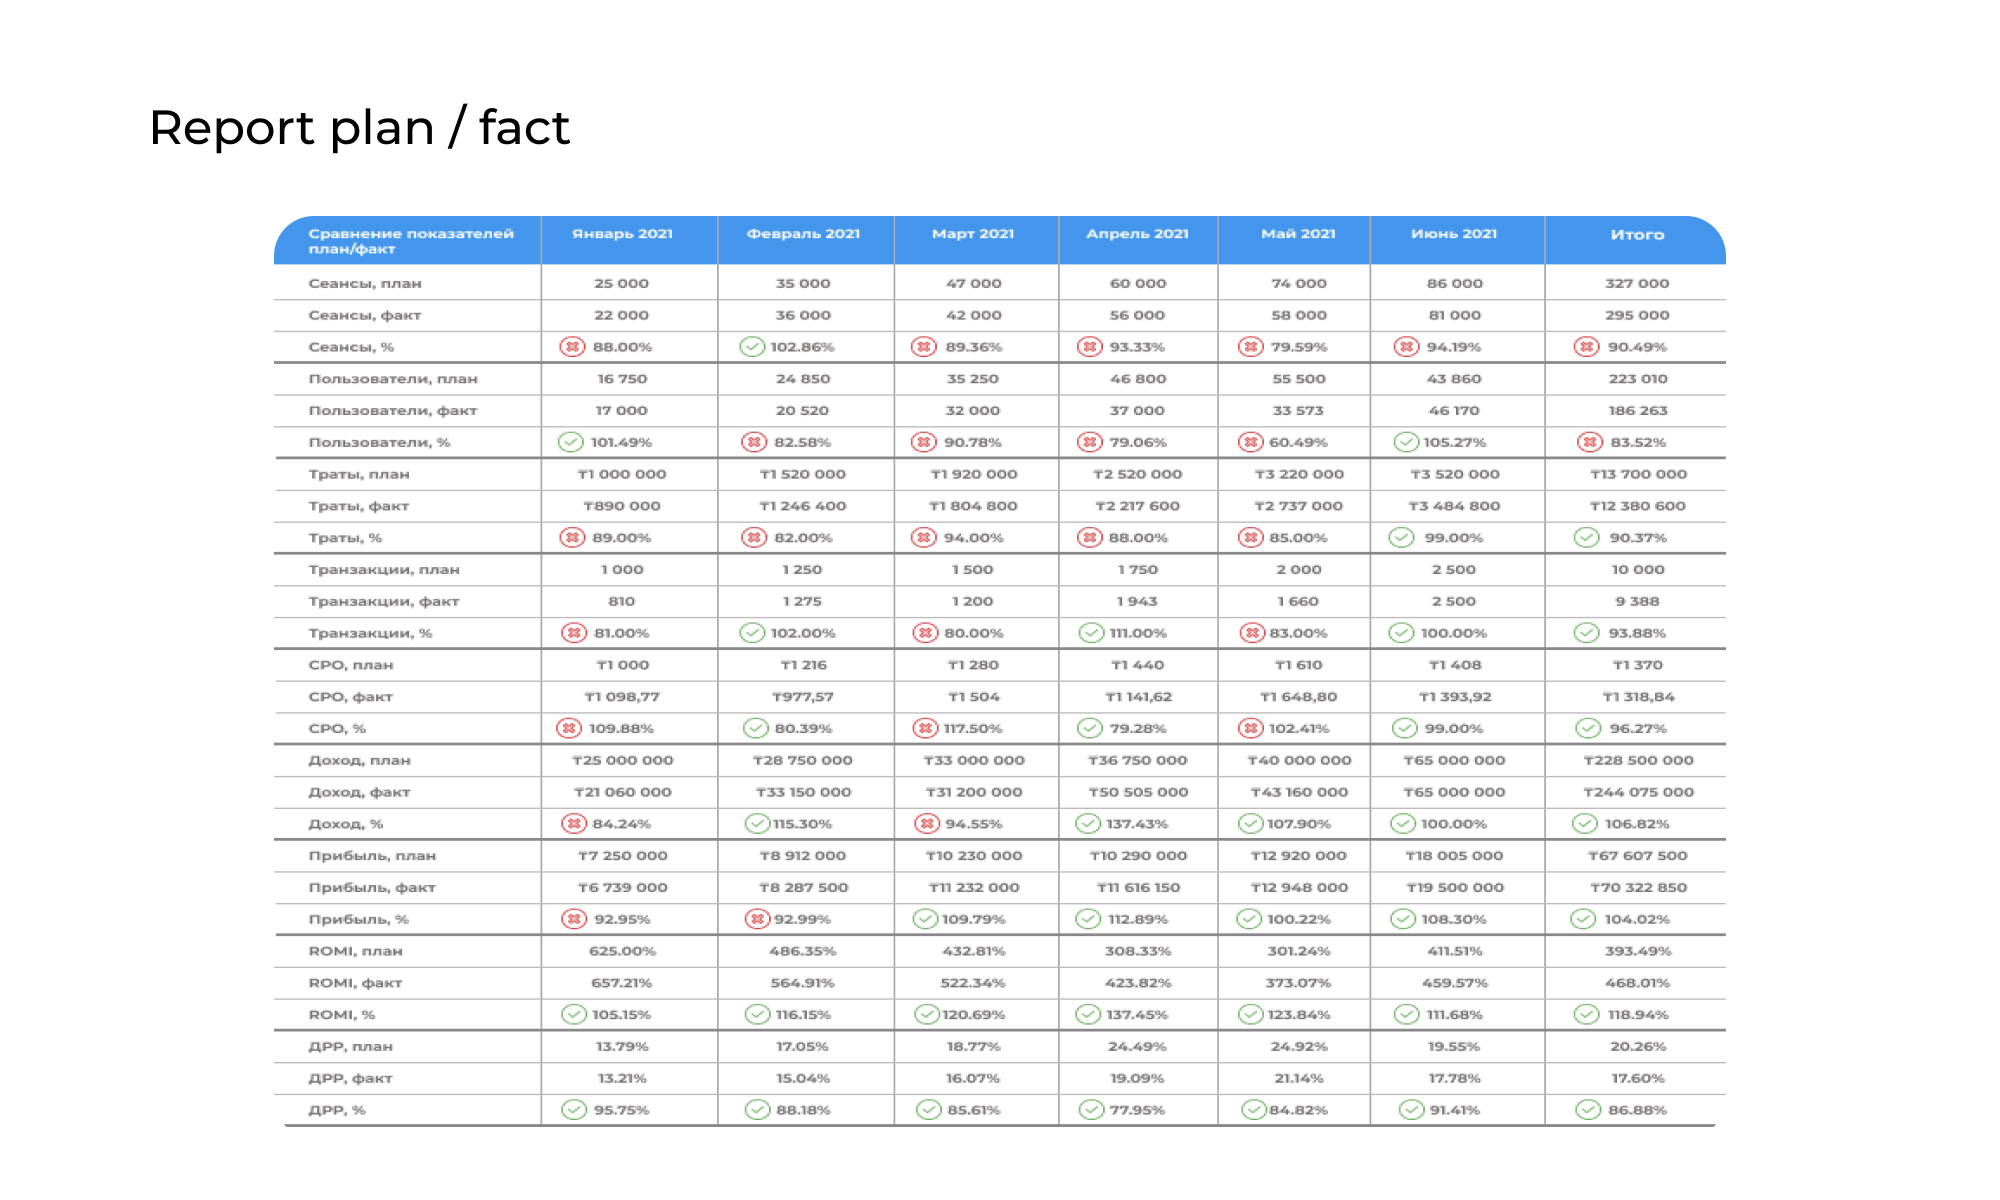
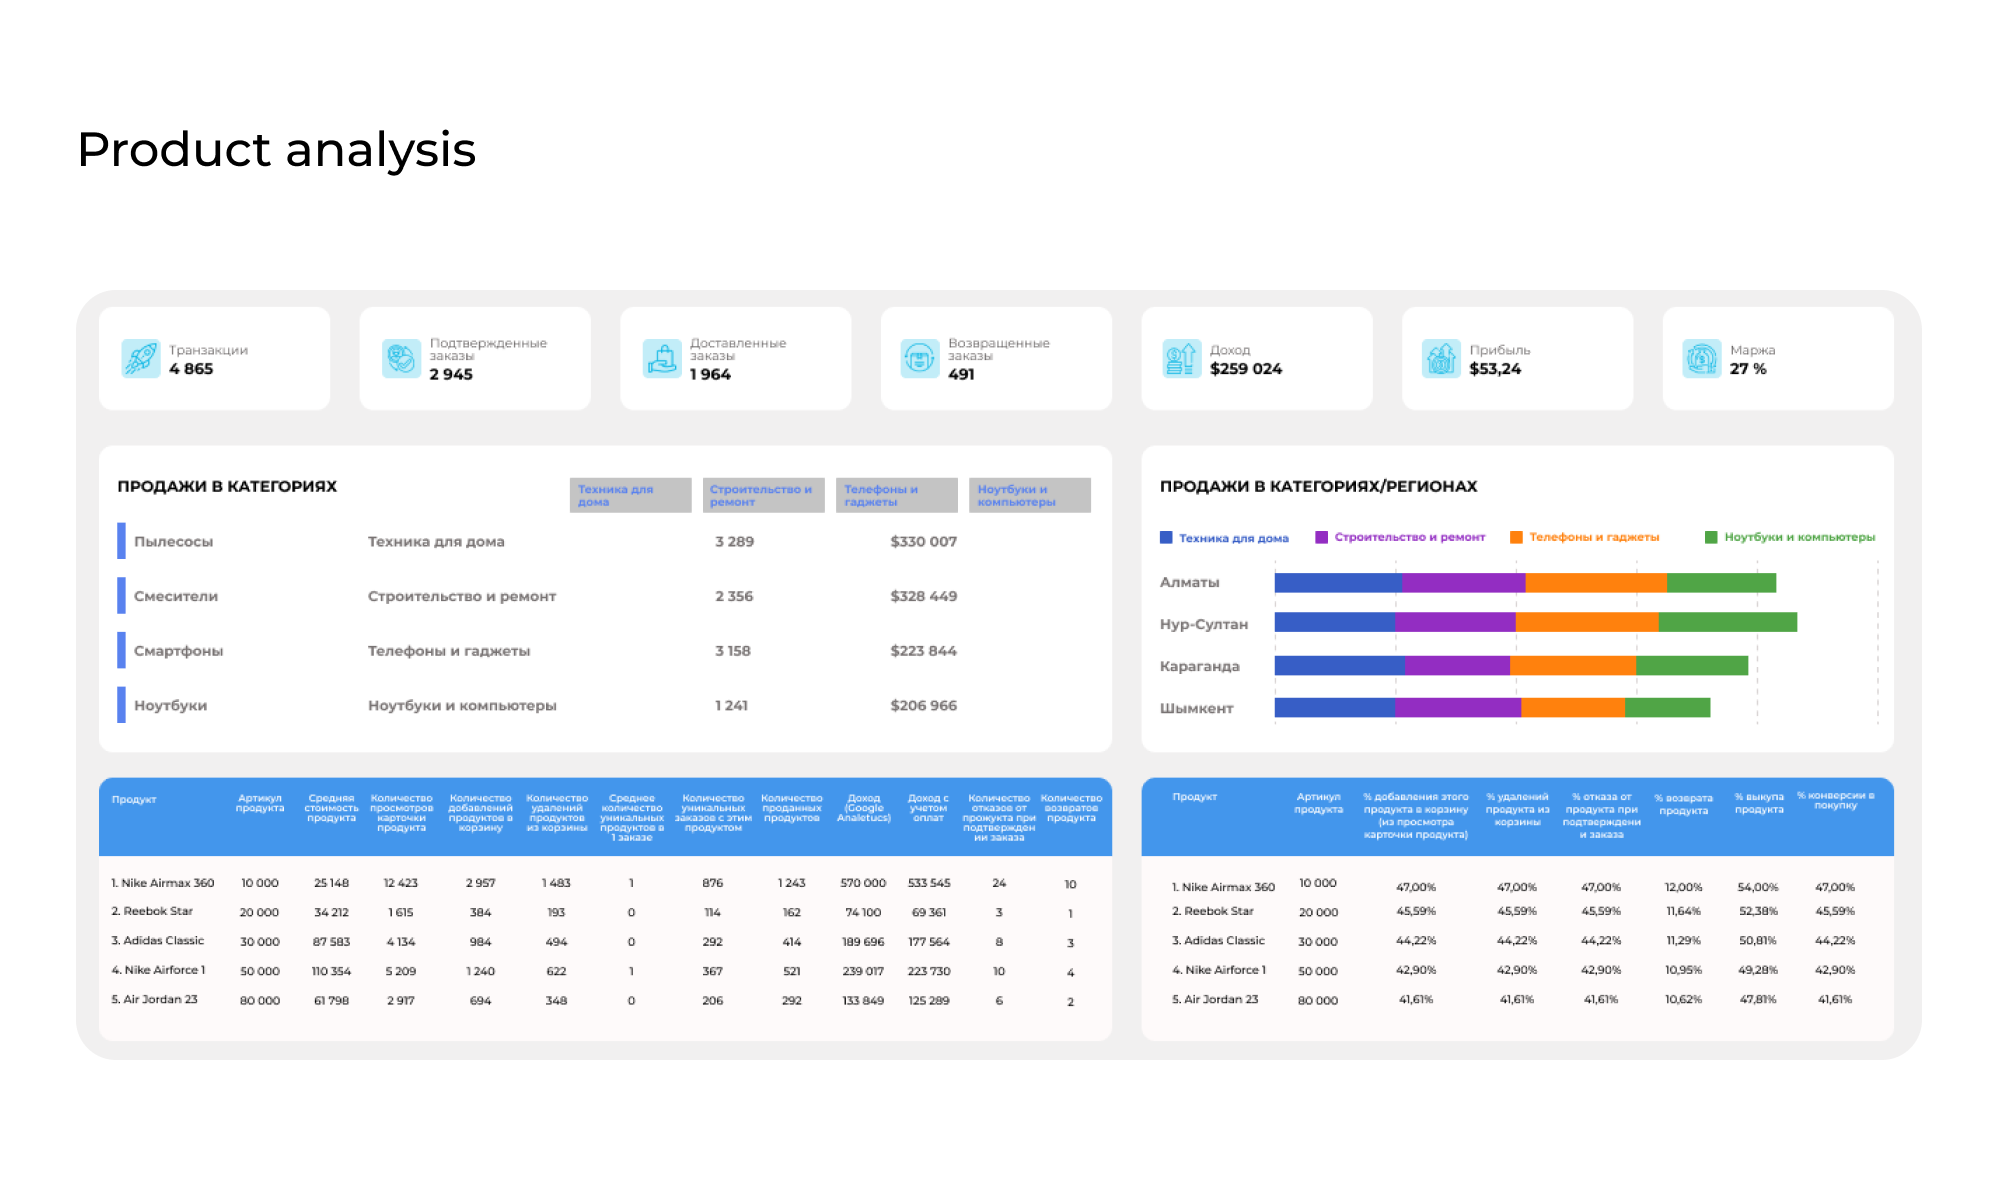
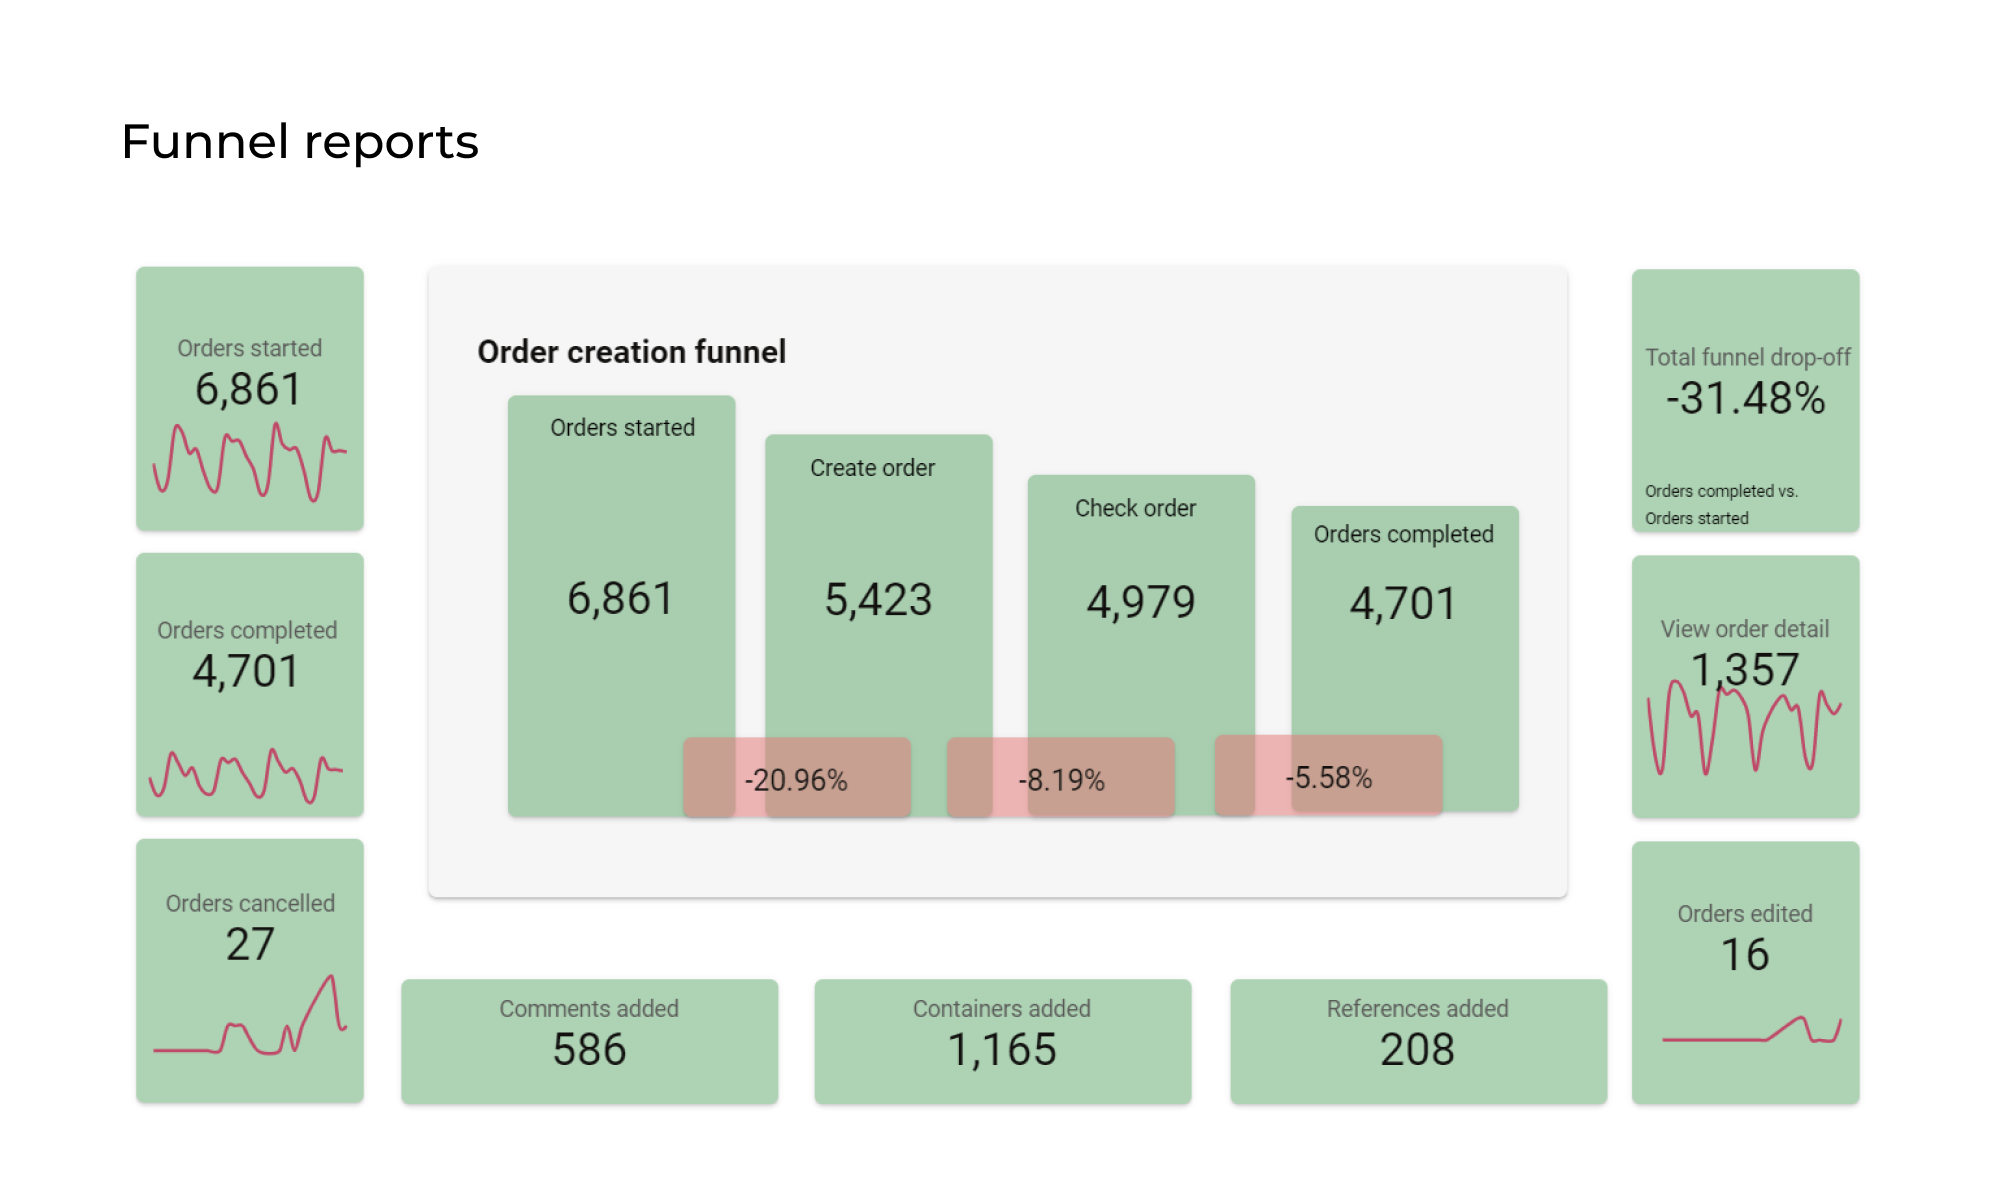
Combine disparate data from several systems: advertising offices, online analytics systems, CRM, ERP, and others. Develop a personalized reporting system.
Establish a customer database (CDP). Create a system that will help you identify the best channels for attracting clients and make effective budget allocation decisions.
Our team helps businesses gain a deep understanding of customers, competitors, and the market. You will make informed decisions and achieve better results in your work.


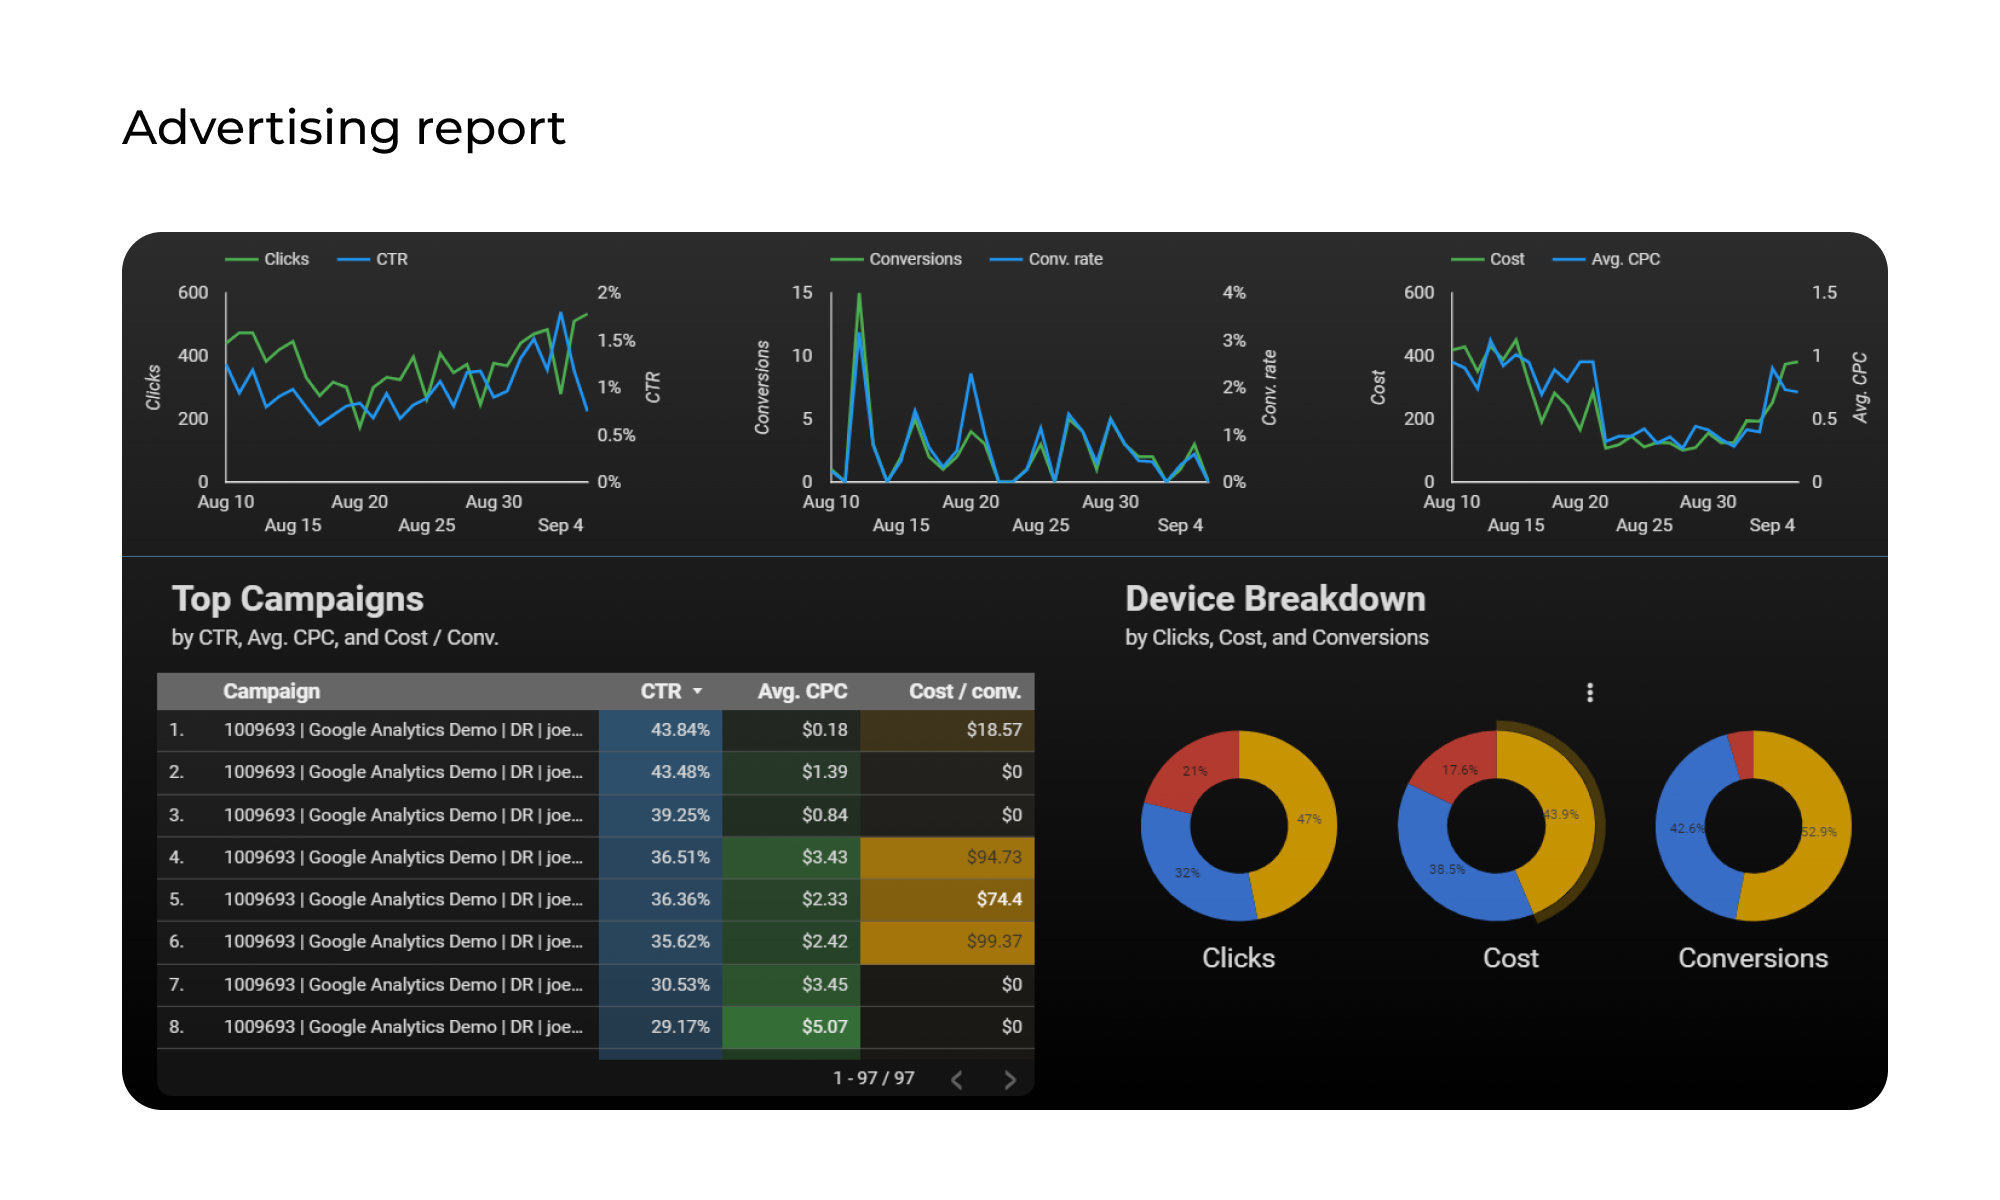
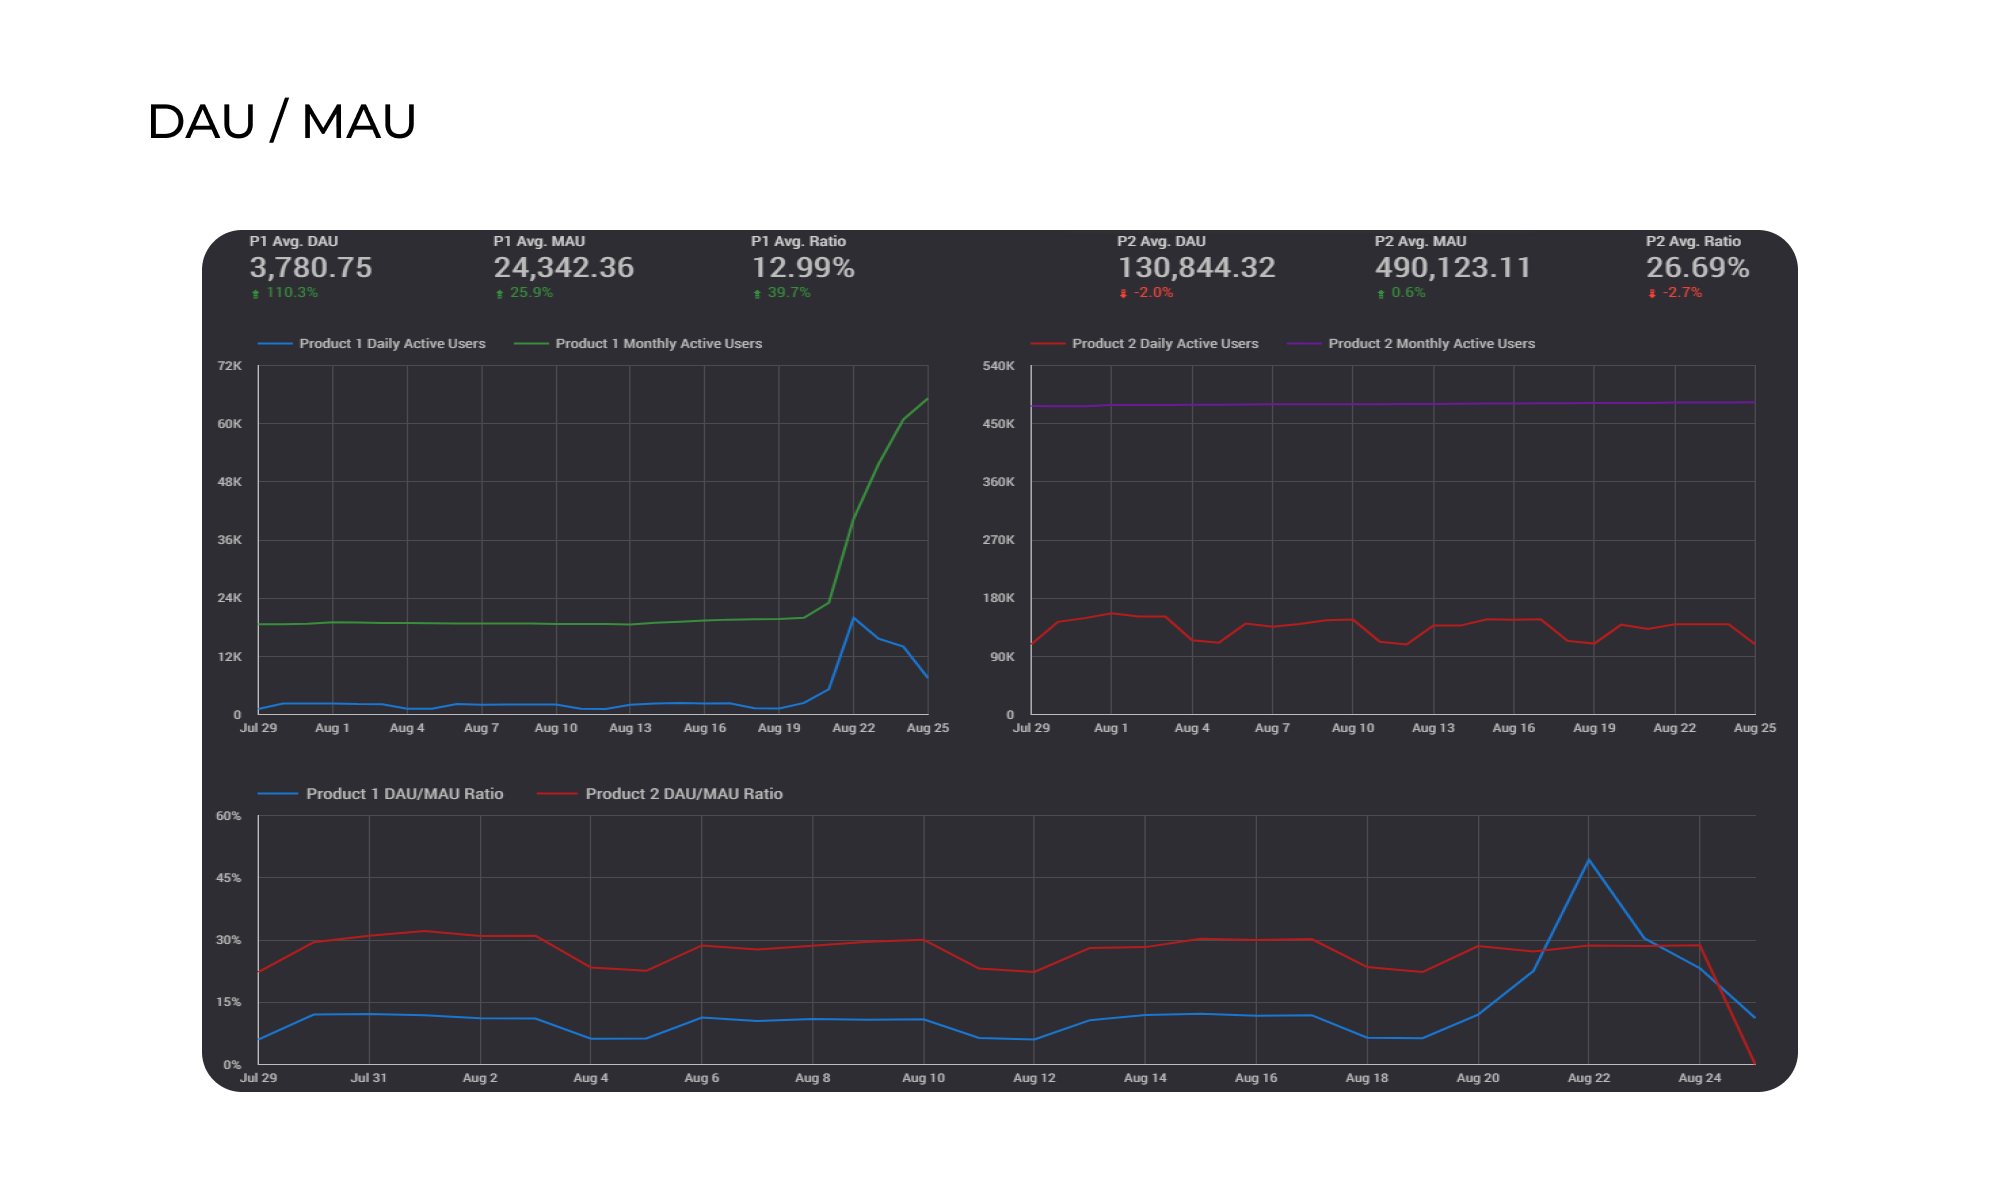
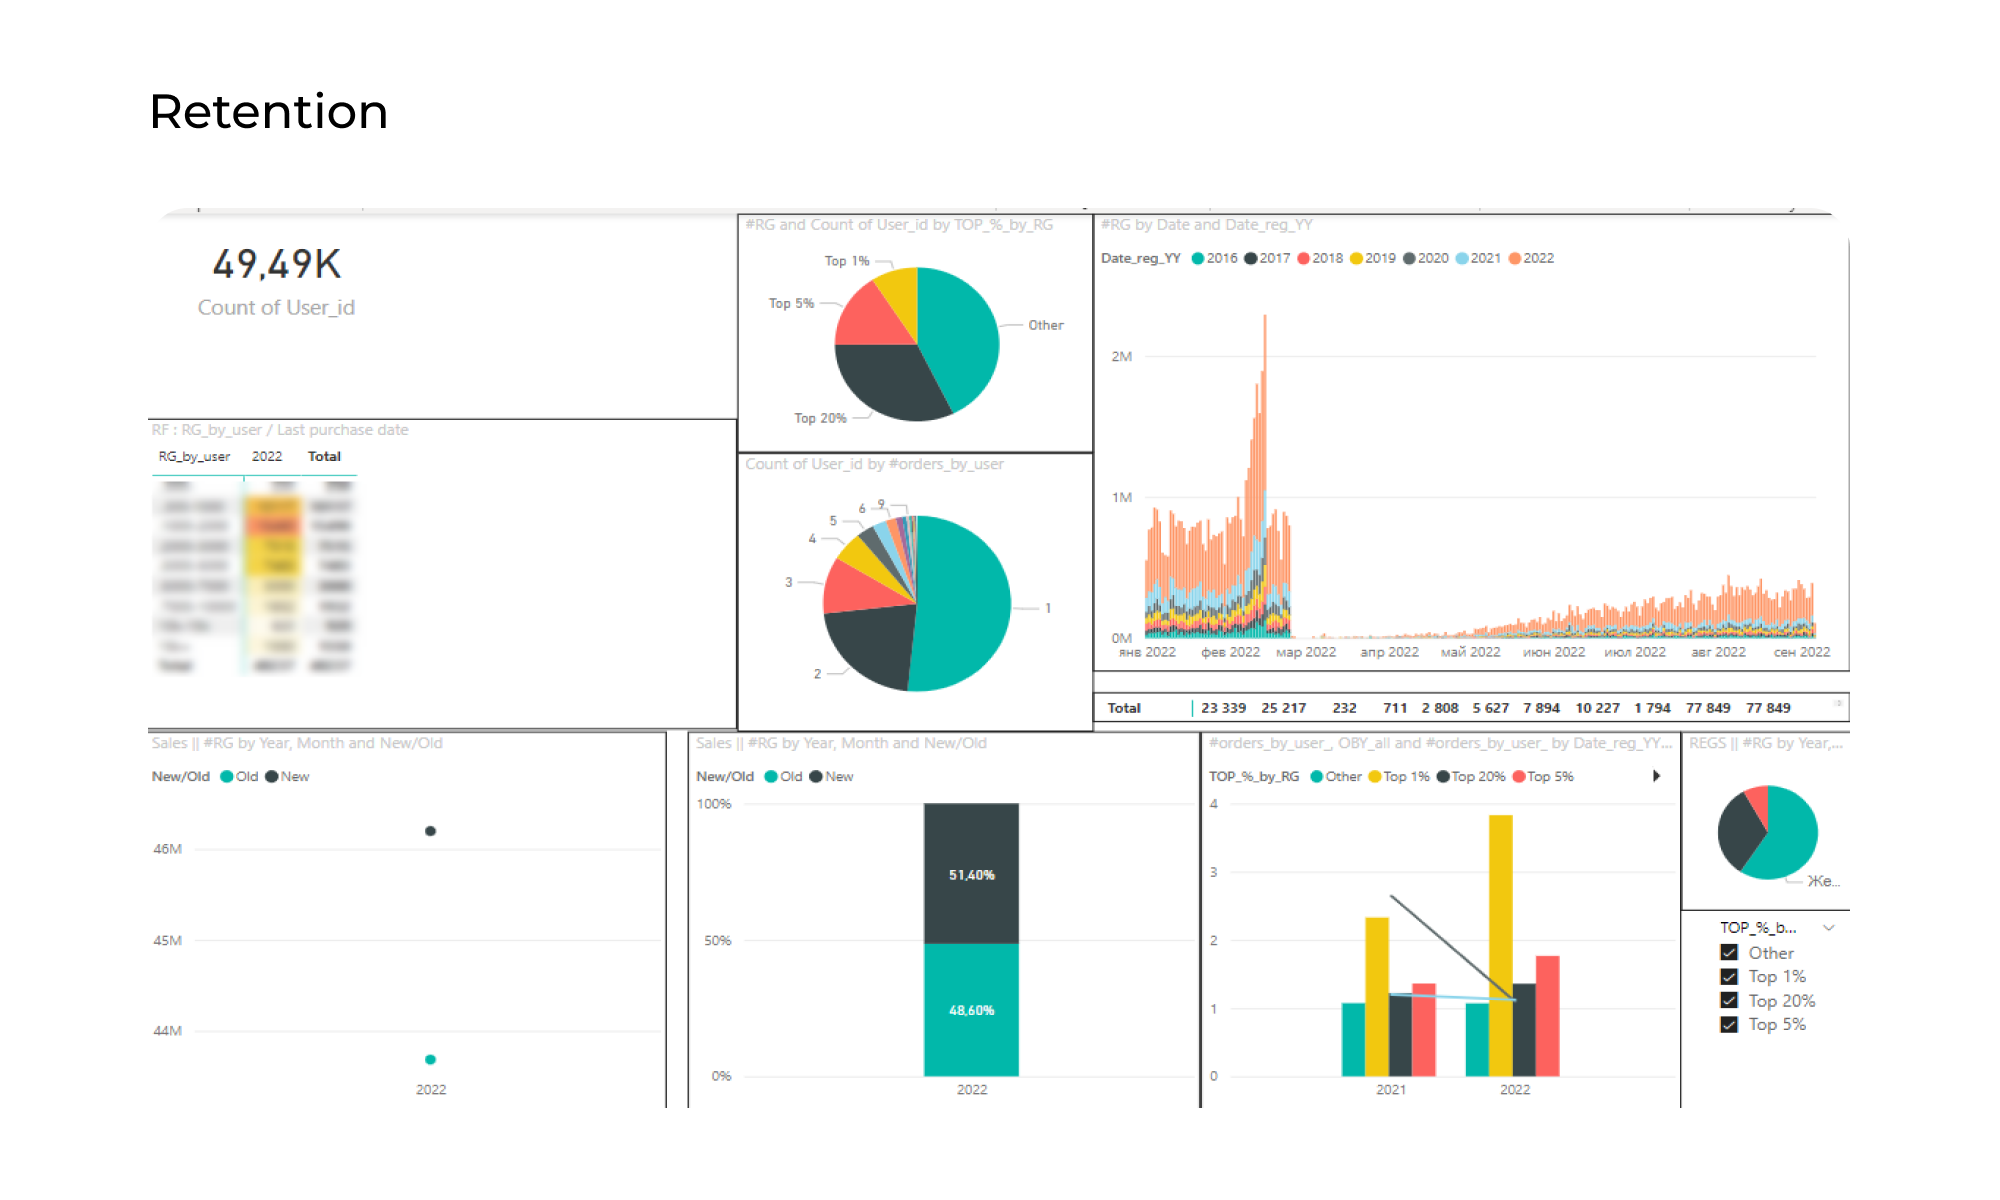
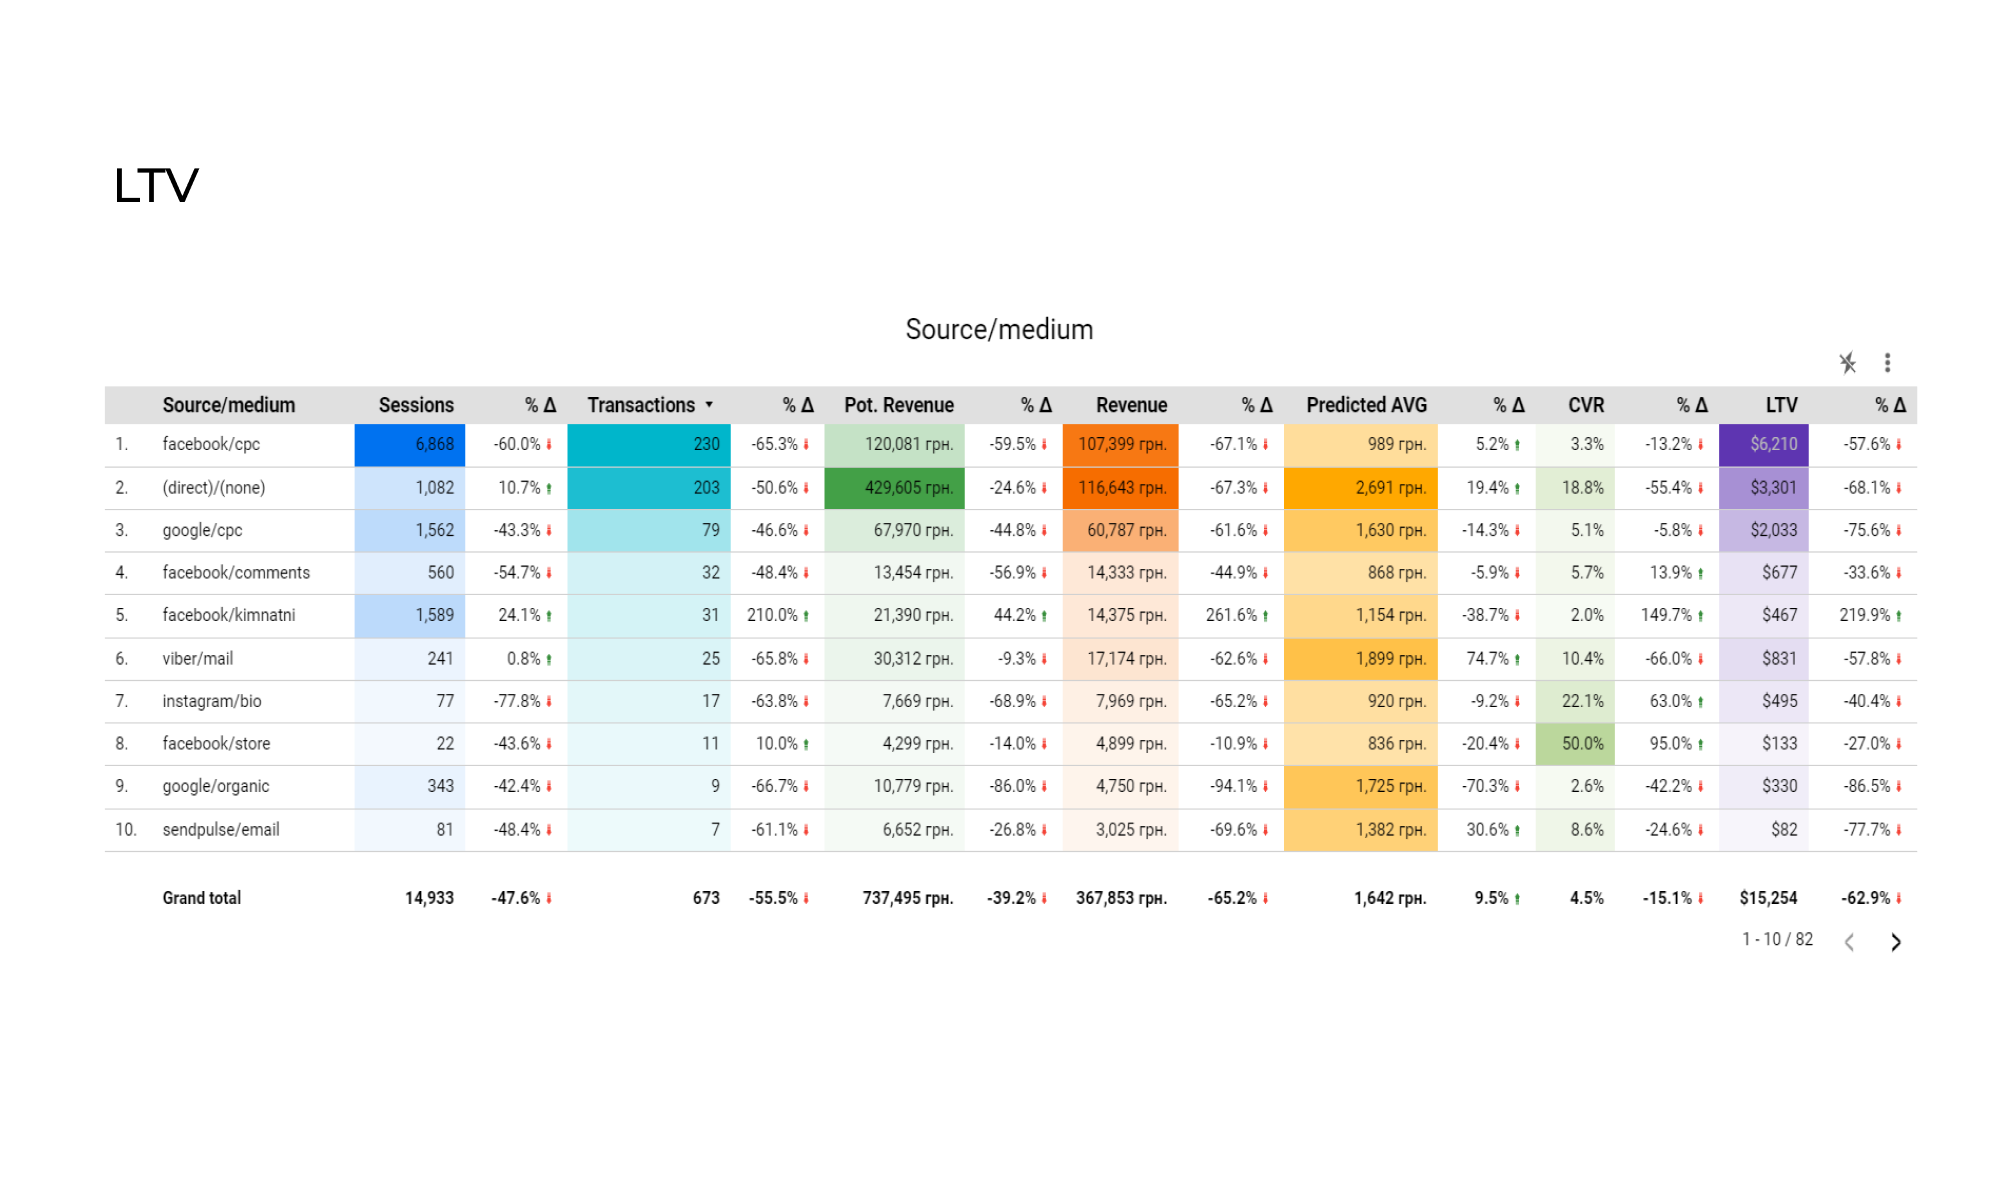
End-to-end analytics (BI analytics for marketing) is a system that automatically collects data from various analytical systems and multiple sources. It then presents this data in the form of reports, dashboards, and graphs that incorporate the main marketing indicators and KPIs of the business.
BI analytics helps businesses evaluate the efficiency of various business processes and identify potential areas for optimization and cost reduction. Using this analytical data, business owners can make informed decisions about product or service development, identify new market opportunities, and improve the competitiveness of their product. Essentially, marketing analytics help a business boost its profitability and achieve its strategic goals.
Who needs BI analytics?
It is worth thinking about implementing BI analytics if:
You have multiple sales sources (website, mobile app, offline stores).
You have several sources of marketing data (advertising offices, Google Ads, Facebook, TikTok, etc.), analytics systems (Google Analytics), accounting systems (CRM, 1C), and tabular data (Google Sheets, Excel).
Your marketing department needs to analyze all customer acquisition channels and sales team performance. For instance, Google Ads, Facebook, Email (Esputnik), CRM, and Google Analytics.
You have a startup where you need to analyze your marketing data in detail during the early stages.
What issues can BI analytics solve?
Difficulties in allocating the marketing budget based on data from tracking the user journeys;
Information overload. If you have many different data sources, it can be hard to make sense of everything;
Sampling in Google Analytics;
Difficulties accessing customer data;
The challenge of setting up a system that can provide insights, hypotheses, predictions, and modeling to improve your product;
Overworked marketing managers or analysts. As the reporting will be automatic, it will offload some of the tasks from team members.
We will first set up and audit the analytics systems. Through a series of meetings with all stakeholders, we will define the reports and metrics to be displayed on the final dashboards.
Next, we will prepare the technical specifications. We select the tools for analytical solutions, prepare the data schema for the final storage, and finalize the appearance of the dashboards.
We then prepare connectors to offload data and deploy the analytical solution in cloud services. We combine, aggregate, and summarize the raw data into final reports. A rendering tool is connected, and dashboards and graphs are created.
After implementation comes the unchanged support phase. It includes updating connectors, adding new sources, and working on reports.


Google BigQuery a fully-managed, serverless data warehouse that enables scalable analysis over petabytes of data. It is an excellent and inexpensive solution for storing and processing data from different systems without having to bind it to a physical server.
MySQL — an open-source relational database management system. Most classic business software products for ordinary users are based on MySQL.
PostgresQL или Postgres — also known as Postgres, is a free and open-source relational database management system that emphasizes extensibility and SQL compliance.
Greenplum — a big data technology tool based on MPP architecture and the Postgres open-source database technology.
R — a programming language that's optimized for statistical analysis and data visualization. It is an open-source free software environment within the GNU package.
Python — a general-purpose programming language considered to be one of the best data science tools for big data jobs and machine learning.
SQL — a structured query language, which is a computer language for storing, manipulating, and retrieving data stored in a relational database.
DBT — an open-source command line tool that helps analysts and engineers transform data in their warehouse more effectively.
Microsoft Power BI — one of the most popular platforms for visualizing data and creating interactive charts and reports.
Google Data Studio — an online tool for converting data into customizable informative reports and dashboards introduced by Google as part of the Google Analytics 360 Suite Enterprise.
Tableau — an American company that develops software for interactive data visualization and business analytics of the same name.

Synchronization is possible with any source;
Flexibility — it is possible to create any report and visualization;
Scalability — you can add any new source that may not even be directly related to digital marketing, such as a sales database;
Data platform — the data can be used for other purposes, such as optimizing advertising campaigns or finding insights;
By directly accessing raw data, we can increase the accuracy of data in the reports.
Synchronization is only possible with a specific list of sources;
You will always be limited to the reports available on the user interface;
The system is usually limited to digital marketing reports;
The data is only used for reports and visualizations;
There's no getting around the architectural peculiarities of boxed solutions, and data loss can be permanent.
Clients often contact us when they see our case studies and portfolios. They start working with the agency thanks to our clear proposal and high-quality strategy. But the financial results keep them working with us: an increase in the number of clients, revenue growth, and profit that exceeds promotion expenses.
That is why the average duration of cooperation between the client and Netpeak is 23 months.
For any service business, perfecting workflow processes is the secret to success. This is what allows us to maintain our level of quality and remain clear and predictable for you — our client.
Monthly planning, SCRUM, checklists for all routine operations and multi-level quality control — all of these allow your team to be in constant synchronization with our experts and achieve your business goals.
Since 2006, we've been working with businesses who want to profit from online marketing, and we are upfront about our victories and our failures. You can check out our client portfolio and read clients’ reviews about working with us — for sure you'll find familiar brands or sites similar to yours.
You can also become one of the 300,000 long-time readers of our blog, where we share our experiences. And of course, you can always come to one of our industry events to get to know us and our approach in person.
Our agency has produced several marketing and analytical software products, and these are used by specialists all over the world. We have a separate team in our production department that constantly develops technology and scripts to automate and speed things up.
What does this mean for you? You get more completed tasks for the same money, and your marketing produces results faster than your competitors.
Regular communication, measurable goals for each process, and automated reporting — we have developed the Netpeak Customer Profile to ensure transparent workflows for all.
At any given time, you can see key project metrics, view progress on tasks, and contact those responsible.


The cost depends on the number of data sources (Google Analytics, Google Ads, CRM, etc.) and several other variables. So, it depends on the project and the tasks for analytics. The timeline is approximately 4 months on average.
Yes, we can integrate the analytics with any CRM system, including self-written ones.
Yes. You will need an ERP system programmer (1C, etc.) to customize data uploads. You will also need a web/program developer to implement technical tasks on the website. Do note that these roles can be handled in-house or outsourced.
You have several options here:
- You can get monthly support from us.
- Alternatively, you can hire an analyst to join your team, and we will train him. We will provide video instructions on our analytics tool that you can always refer to. We will also give you a manual on how to use the system, which can be inserted into job descriptions and company business processes.